Label Popup
Label popup is a feature used to display the metadata of the labels and other
entities of Function Overview Diagrams, Interactive models, SVG images and the
calibration parameter values.
To display the Label popup click on the label. This feature is applicable for labels
and all other entities.
The Label popup for Curves and Maps are displayed as 2D/3D visualization of the
plot data.
The data can be visualized in the Label popup if the variant-coded label(s) is(are)
present in the content.
-
Label popup
-
Pin window
-
Close window
-
Exporting functions
-
Importing functions
-
Show More/Less
-
Annotations table
-
Defining functions
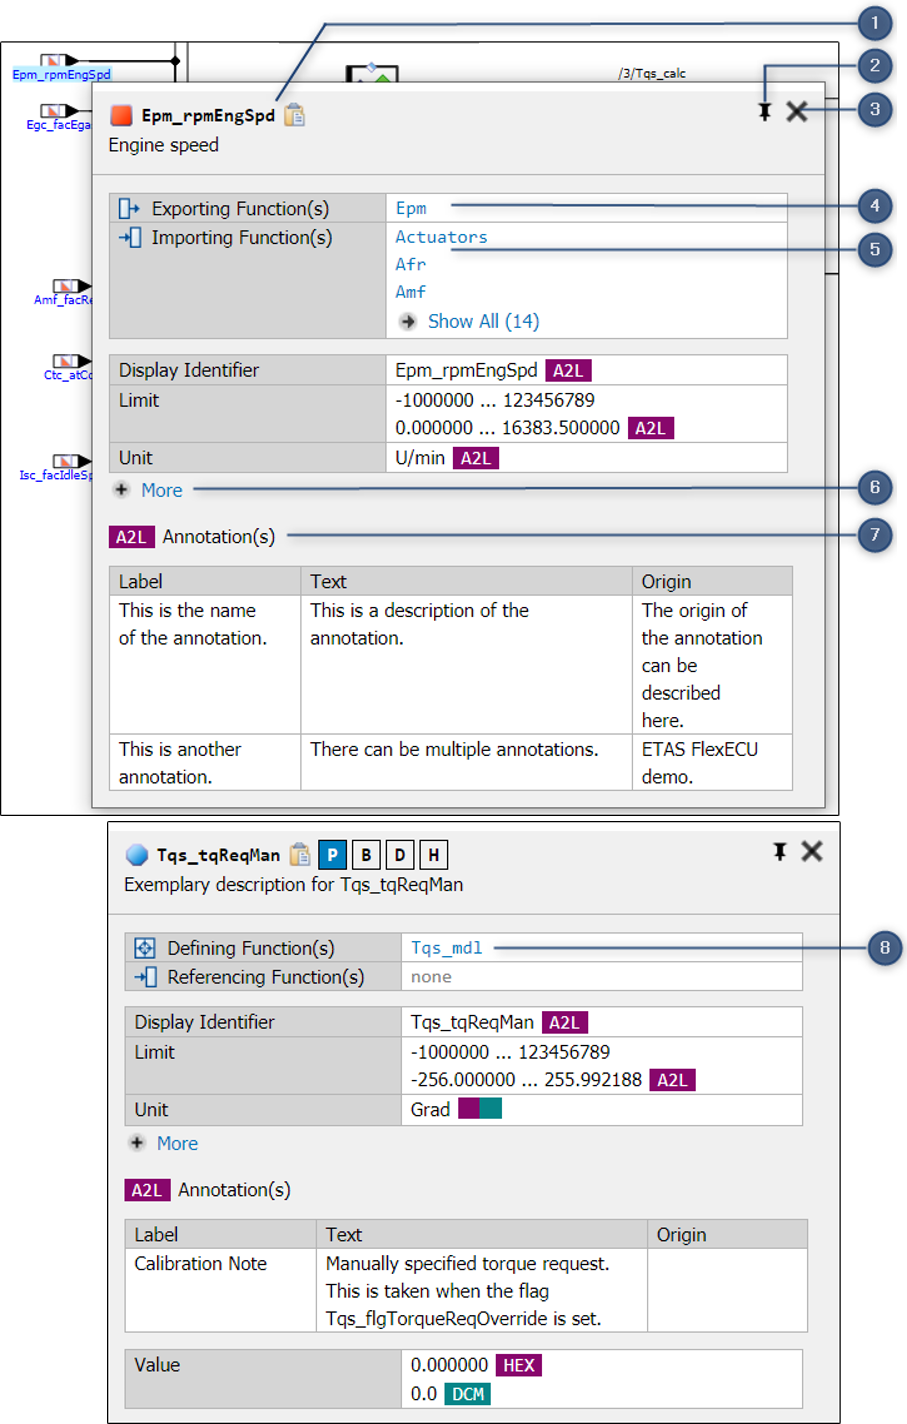
The Label popup displays the Exporting Functions, Importing Functions, A2L
Annotations, Defining functions, and Property Values of a label/entity. By default,
the Label popup displays the Exporting/Importing/Defining functions. Click on the
More hyperlink to display the Property Values. Clicking Less hyperlink hides the
Property Values.
The Label popup window can be re-sized by moving the cursor over the top or
bottom border of the window, until the cursor becomes a double-headed arrow,
then click the left mouse button and drag as required to reduce/increase the size
of the window.
The label popup can be pinned by clicking on  icon which is available at top-right
corner of the Label popup. If it is pinned, then it is displayed always, even when
any other label popup is opened or any other operation is performed in the application.
You can minimize or maximize the Label popup window. The pinned Label
popup can be closed by clicking
icon which is available at top-right
corner of the Label popup. If it is pinned, then it is displayed always, even when
any other label popup is opened or any other operation is performed in the application.
You can minimize or maximize the Label popup window. The pinned Label
popup can be closed by clicking  icon.
icon.
|
If a Label popup is not pinned, then it closes automatically when any other operation is performed in the application or when you click outside the popup area. |
-
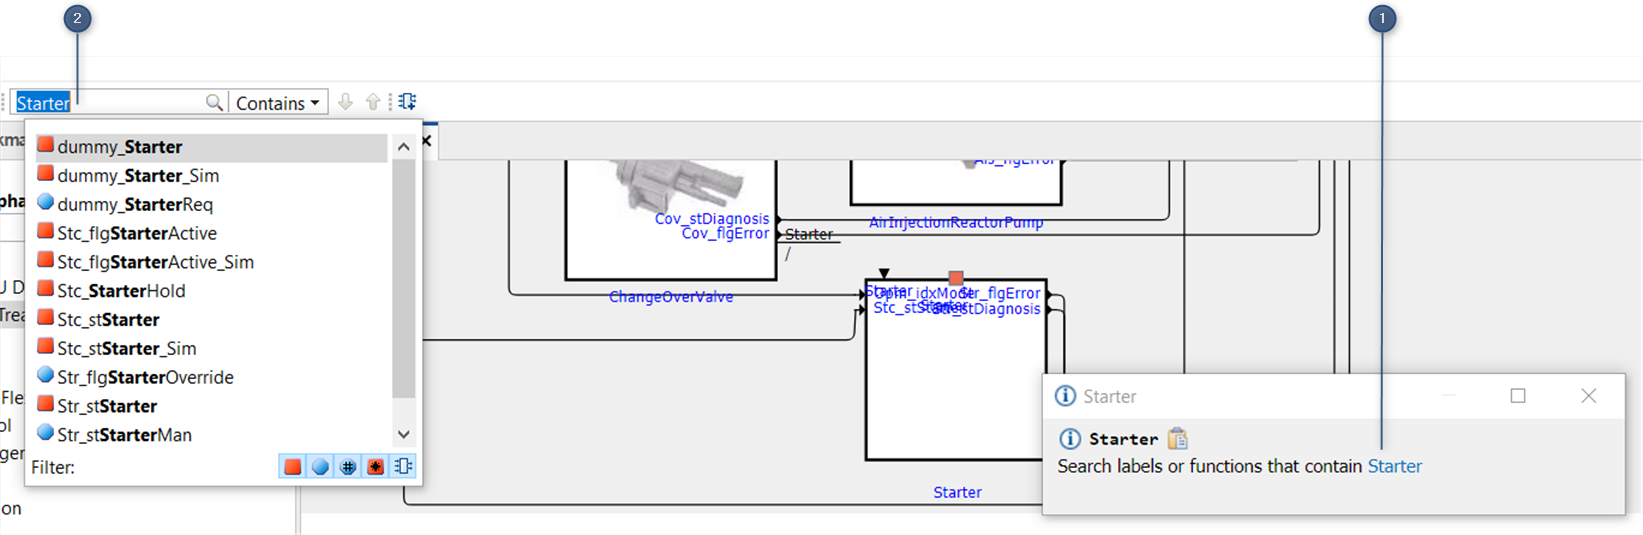
Label popup with message string
-
Find in EHANDBOOK File(s) field
The labels for which metadata is not available, a message string gets displayed. This contains a clickable link with the same label name which copies the text to the Find in EHANDBOOK File(s) box followed by display of search proposals. The data can be visualized in the Label popup if variant-coded label(s) is(are) present in the content
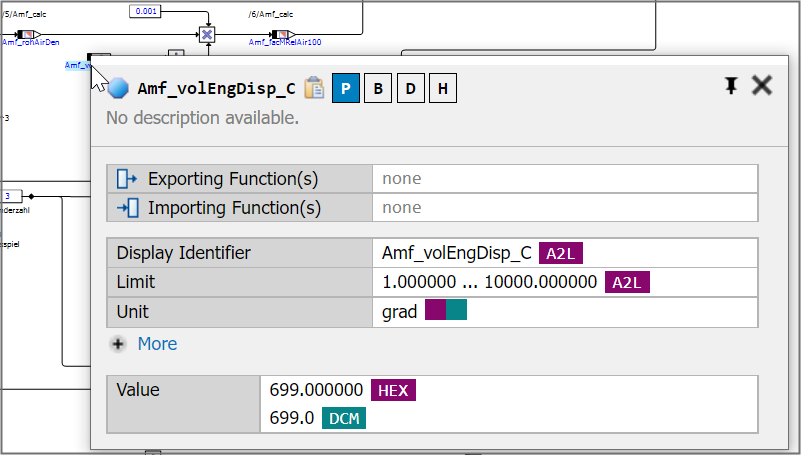
Viewing the Properties of a Label
To view the set of properties and their relevant values for a label:
-
Click on a label in the Document Viewer/Interactive Model/Function Overview Diagram.
-
The related set of properties and their relevant values are displayed in the Label pop-up.
Viewing the Properties of a Curve/Map
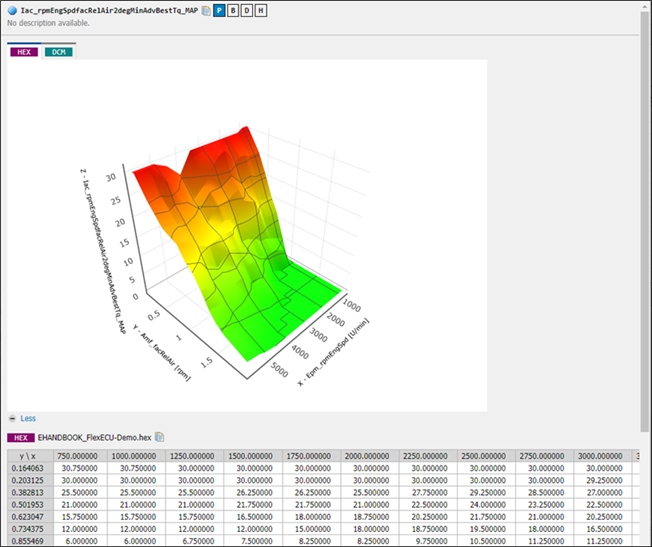
The Label popup for the Curve (CUR) displays the plot data in 2D view, for the Map (MAP) displays in 3D view. This helps to understand more quickly how a curve/map is calibrated.
It takes the data from the loaded A2L (*.a2l) and HEX (*.hex, *.s19) or (and)
DCM (*.dcm)/CDF (*.cdfx)/PaCo (*.xml) files.
To load the A2L+HEX or (and) DCM/CDF/PaCo files and view the set of properties and their relevant values for a Map/Curve is described below:
To load the A2L+HEX or (and) DCM/CDF/PaCo files:
-
Go to
Datamenu →Measurement and Calibration Files.
Measurement and Calibration Filesdialog box is displayed. -
Select the A2L+HEX or (and) DCM/CDF/PaCo files and click
Load.
The selected A2L+HEX or (and) DCM/CDF/PaCo files are loaded.
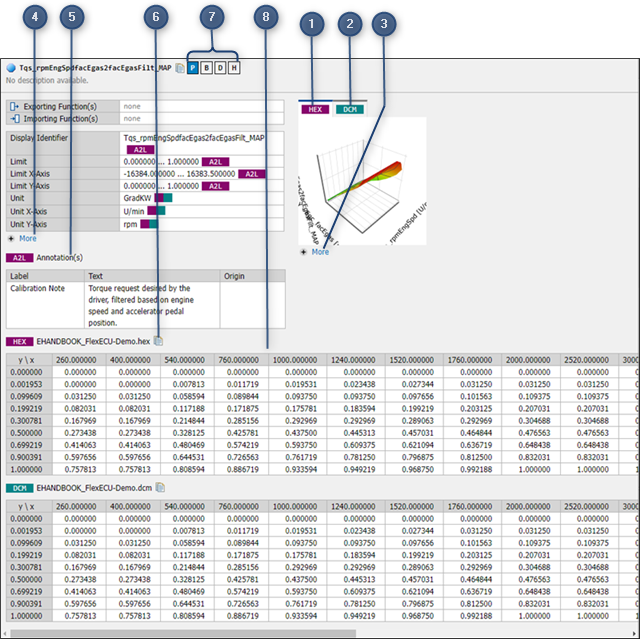
To view the values for a Map:
-
Click on a label of the Map value (mostly ending with _MAP) in the Document Viewer/Interactive Model/Function Overview Diagram. 3D view of data and the related set of properties and the annotations information and its relevant values in the loaded A2L+HEX or (and) DCM/CDF/PaCo are displayed in the Label popup as shown below.
-
HEX tab
-
DCM/CDF/PaCo tab
-
Show More/Less
-
Show More/Less
-
Annotations table
-
Click to copy table to clipboard icon
-
Values in a tabular format
-
Values of calibration parameters
If both the files (A2L+HEX and DCM/CDF/PaCo files) are loaded, you can view
both the tabs in the Label popup window. If any one is loaded, then the corresponding
tab only is shown in the Label popup.
HEX tab (1) displays the image which is loaded from the A2L+HEX file.
DCM/CDF/PaCo tab (2) displays the image which is loaded from the
DCM/CDF/PaCo file.
The annotations table (5) dislplays the calibration information which are available
in the loaded .a2l file.
The values of calibration parameters which are available in the loaded .a2l and
.hex files are displayed in a tabular view. The values can be viewed in 4 different
formats.
-
Physical
-
Binary
-
Decimal
-
Hexadecimal
By default, Physical values are displayed. You can switch between these formats
by clicking on the respective tabs which is available on the top of the label popup.
The same can also be performed by using the keyboard shortcuts <CTRL+P>, <
CTRL+B>, <CTRL+D>, and <CTRL+H> for physical/binary/decimal/hexadecimal
respectively.
To copy data from a calibration table:
You can copy the table data displayed in the label popup for a curve or map and
paste it into Microsoft Excel.
-
Click
 icon (6) to copy the values.
The data will be copied to the clipboard. -
Open Microsoft Excel.
-
Click on the Excel cell where you want to paste the data.
-
Click <CTRL+V>.
The copied table will be pasted into Excel.
|
a) By default, table data is represented as the US decimal number format (point
as decimal separator) in the clipboard. Since the number format differs on languages,
for example, the point as decimal separator is interpreted as a thousand
separator when pasting into a German Excel application. |
To view the values for a calibration parameter:
You can load any one tab at a time by selecting the corresponding tab.
-
Click on the
More(4) hyperlink to display all the Property Values.
-
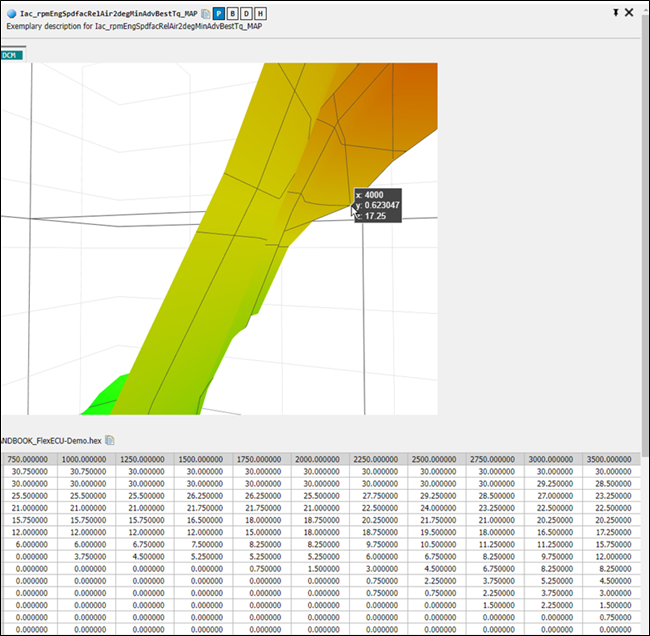
Click on the
More(3) hyperlink to display the enlarged view of the image.
Since it is the 3D view, EHANDBOOK allows you to rotate the view. It is also possible to zoom-in/zoom-out the image by using the mouse scroll. When you hover the mouse over the plot area, plot coordinates are displayed as shown in the image below.
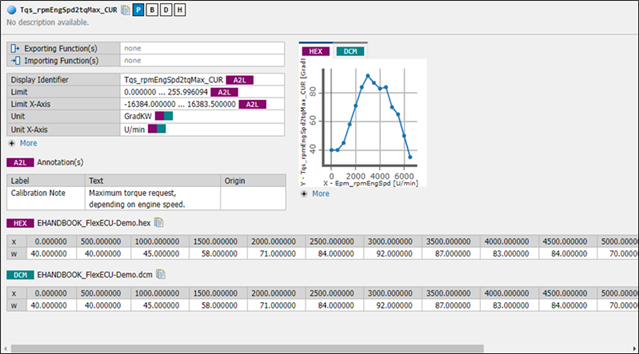
Similarly, the set of properties and their relevant values can be seen for a Curve
also. It is also possible to zoom-in/zoom-out the image. The coordinates are also
shown when you hover the mouse over the plot.
To view the data for a Curve:
-
Click on a label of the Curve value (mostling ending with _CUR) in the Document Viewer/Interactive Model/Function Overview Diagram.
2D view of data and the related set of properties and the annotations information and its relevant values in the loaded A2L+HEX or (and) DCM/CDF/PaCo are displayed in the Label popup as shown below.
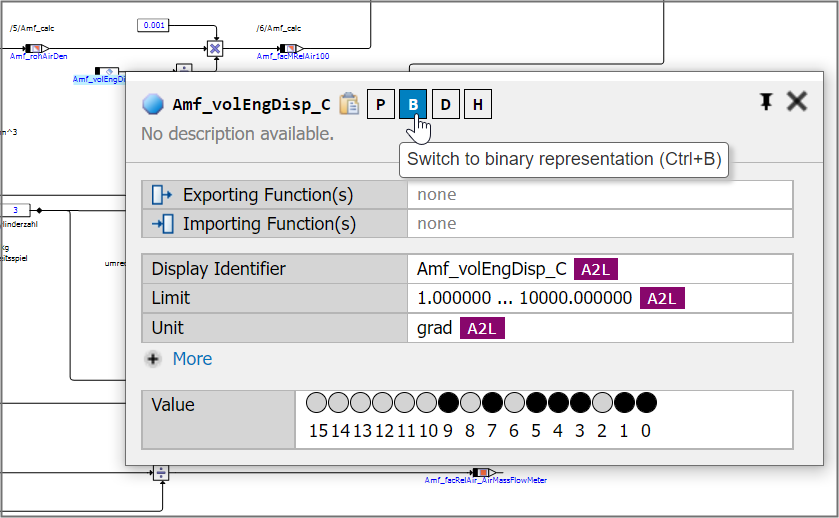
Binary Representation for a scalar calibration parameter
To view the Binary values for a scalar calibration parameter:
You need to load the A2L and HEX files. Refer to Viewing the Properties of a Curve/Map.
-
Select and click the calibration parameter in the Document Viewer/ Interactive Model/Function Overview Diagram.
A label pop-up displays.
-
By default, Physical values are displayed. You can switch to Binary Values by clicking on
 the button which is available at the top of the label popup.
The binary values are displayed at the bottom along with the bit number. A set bit (1) is represented by a black circle and an unset bit (0) is represented by a grey circle.
Loading the Topic of an Importing/Exporting/Defining Function
To load the topic of an Importing/Exporting/Defining function for the selected label:
-
Select the label in the Document Viewer/Interactive Model/Function Overview Diagram.
The related set of properties and their relevant values are displayed in the Label pop-up.
All the available Importing, Exporting or Defining functions for the selected label are displayed. -
Click on Importing/Exporting/Defining function(s) hyperlink to navigate to the respective Functional Components or Functions.
The topic of the selected Importing/Exporting/Defining function is loaded in the Document Viewer
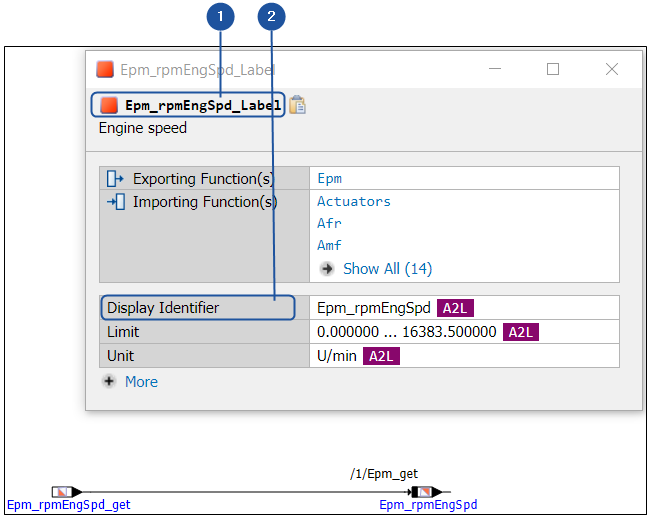
Display Identifier
EHANDBOOK-NAVIGATOR displays the label name in the Model Viewer. This label
name could be a short name or a Display Identifier. When the Display Identifier is
used in an EHANDBOOK Container and you load a matching A2L file, then the
Label Pop-up displays the short name in the title. The Display Identifier is shown
separately in the properties.
In general, the short and long name is a term in the ASAM standards:
-
short name:
The label name which is displayed -
long name:
The description of a label -
Display Identifier:
The alias name of a label, this could be shown instead of a short name
-
Name of the label
-
Display Identifier
When you search for the label in all Find in EHANDBOOK File(s)and if the Display
Identifier of a label is available, then search hit displays both the entries (the long
name and the short name) in the Search Result View.
In few specific cases, the Label Pop-up displays the Display Identifier in the title
as main label name instead of the long name. The long name is displayed in the
"Name" field inside the Label Pop-up. When you search a label by specifying the
long name in the Find in EHANDBOOK File(s), EHANDBOOK-NAVIGATOR displays
the result for long names as well.
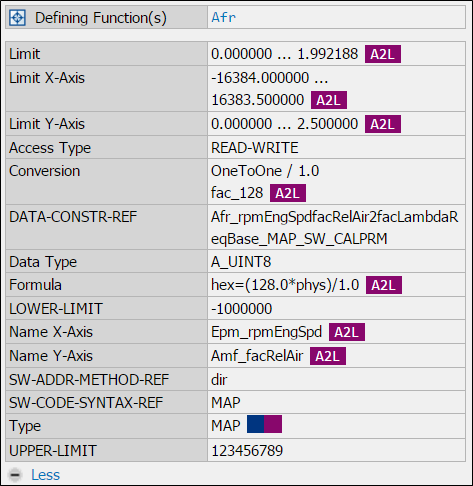
Shows Conversion values
The conversion property shows the COMPU_METHOD associated with the label. The types of COMPU_METHOD table are:
-
COMPU_TAB
-
COMPU_VTAB
-
COMPU_VTAB_RANGE
If there is no mapping table available, then only compuMethod name is displayed.
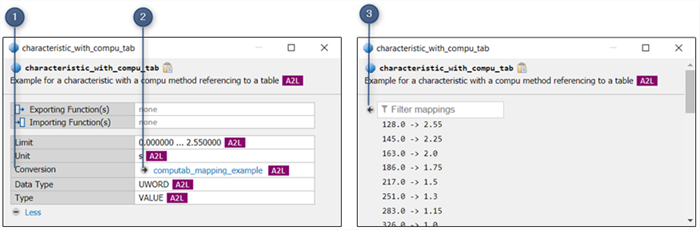
COMPU_TAB
The COMPU_TAB is a mapping between two numbers.
-
Conversion
-
Show mapping values
-
Back to overview
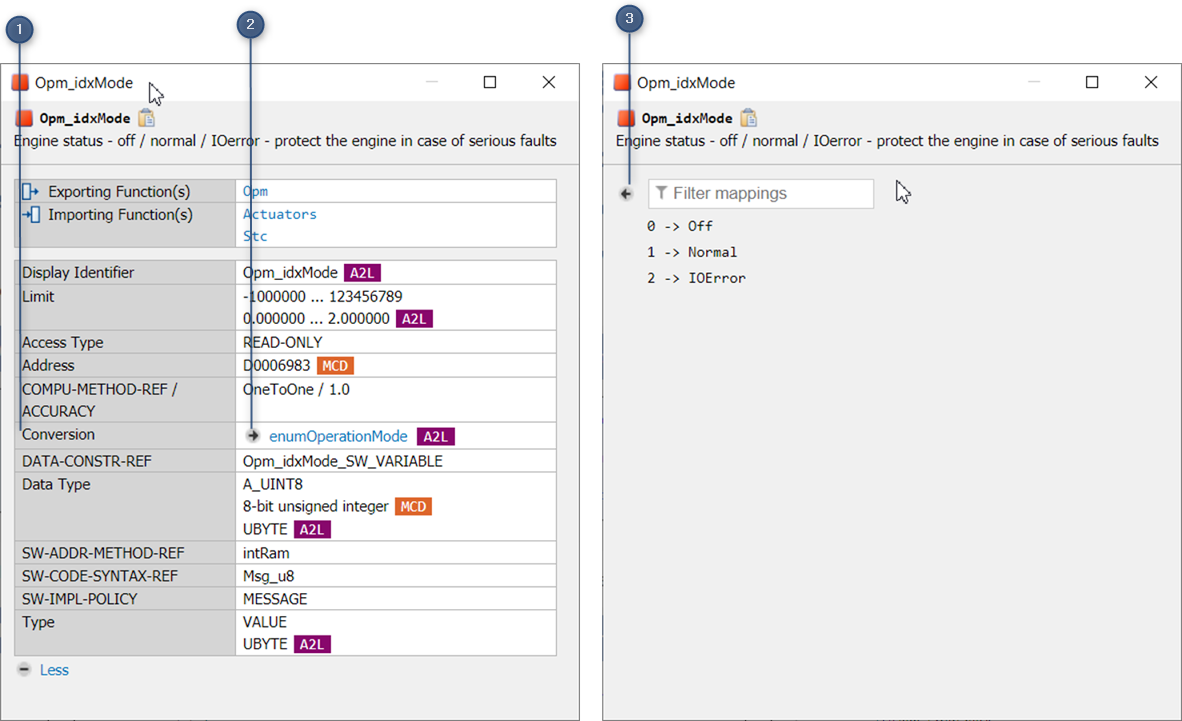
COMPU_VTAB
The COMPU_VTAB is a mapping between number and a string.
-
Conversion
-
Show mapping values
-
Back to overview
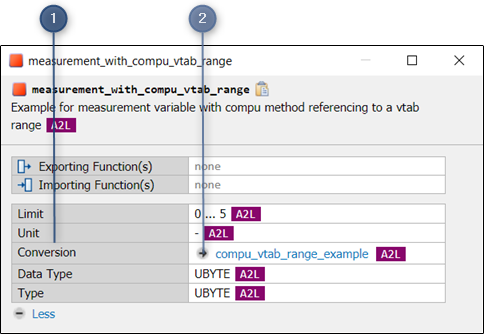
COMPU_VTAB_RANGE
The COMPU_VTAB_RANGE is a mapping between range of number and a string.
-
Conversion
-
Show mapping values
-
Back to overview
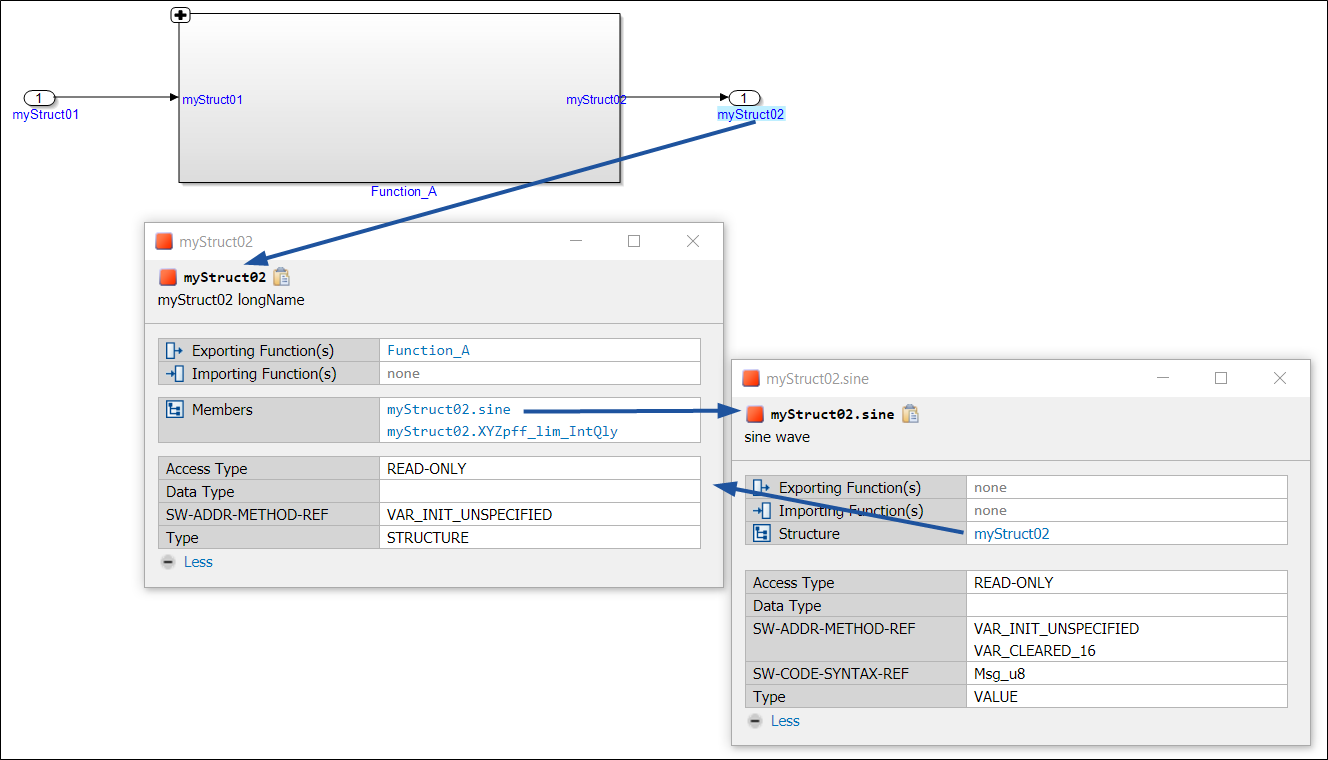
Support of Structure Data type
EHANDBOOK-NAVIGATOR supports the STRUCTURE data type in Simulink models
which establishes an end-to-end signal flow across two ECU functions via labels.
The label popup of a structure displays the structure information and its contained
members. The label popup of a structure member displays the member
information and links to its parent structure.
A structure is mapped to a Simulink bus and structure members are mapped to
Simulink bus signals. Structure members are separated by a delimiter e.g. a dot.
For example, myStruct02 is the structure/bus name and myStruct02.sine
and myStruct02.XYZpff_lim_IntQly are the structure members where sine
and XYZpff_lim_IntQly are the signals of the bus, myStruct02.
The Search proposal also shows entries for structures and structure members.