How to Configure C-Code Visualization
This page explains how to customize the visualization of C-Code as block diagrams and handle preprocessor macros.
Configuration for C-Code Visualization
The visualization of C-Code as block diagram can be customized through several configurations. These can be adapted in such a way that the program logic is represented more precisely and that the graphical visualization can be understood more easily.
The configuration options are provided through a central configuration file in XML format. The configuration file is to be passed using the command-line option -ccodemeta with
"path_to_meta_file/name.xml" as argument.
The following shows the XML template for the C-Code configuration options.
<?xml version="1.0" encoding="UTF-8"?>
<functionmetadata:FunctionMetadataRoot
	xmi:version="2.0"
	xmlns:functionmetadata="http://www.etas.com/ehandbook/functionmetadata"
	xmlns:xmi="http://www.omg.org/XMI">

	<globalConfiguration
		libraryPath="../lib"
		inlineFunctions="true"
		simplifyDiagram="true"
		generateHierarchies="true"
		maxIterationForDataflowAnalysis="50000"/>

</functionmetadata:FunctionMetadataRoot>
The configuration options are described in the following:
libraryPath
For a given ECU function, having a set of C-files with implementations, the C-functions call other C-functions as sub-routines or service routines.
A suitable way to arrange such ECU specific C-files and global sub-routines is to configure where C-files for ECU functions are placed, and where the global sub-routines are placed.
This configuration specifies the location of all such global sub-routines or other C functions which could be present in a true either .c files or .h files.
These files typically contain helper or utility functions for the ECU specific C-files.
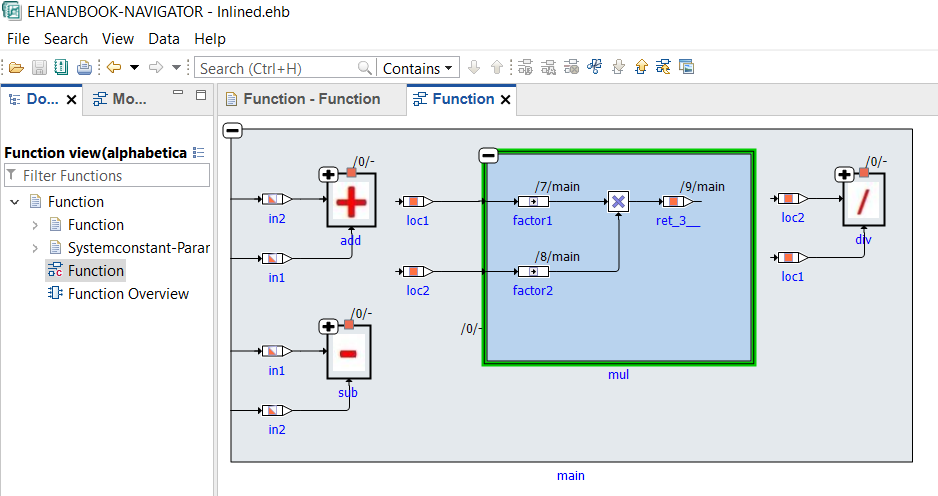
inlineFunctions
This configuration can be set to true/false in order to enable/disable the graphical inlining of called C-functions into the context of the calling C-functions.
Default setting: inlineFunctions=false
If set to true, the model visualizes the called function (e.g. global sub-routine/other C functions) as an expandable block within the block of the calling function.
|
For clearness, the Inlined C-functions are removed from the top level. Therefore, no model screenshots for these functions can created via -gensvg. |
Example: The C-function mul is called from C-function main.
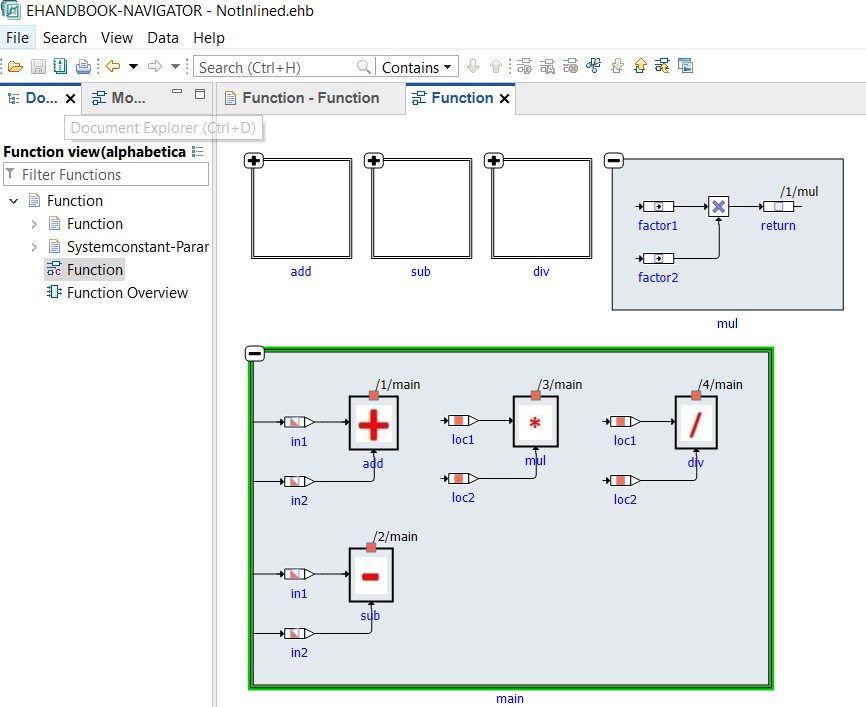
If set to false, the model visualizes the called function (e.g. global sub-routine/other C functions) as non-expandable block within the block of the calling function. Note that the called functions are visualized as top-level expandable blocks.
This configuration can be used to obtain visualizations of C-libraries, for example.
Example:
simplifyDiagram
This configuration takes in a true/false to enable/disable simplification of C-Code model. When enabled, unused variables and code from visualization are omitted, thereby decluttering and consequently simplifying the model visualization. However, the simplification can be disabled to view the actual model aiding in verifying the correctness of the model in comparison to the original source code, if required.
Default setting: simplifyDiagram=true
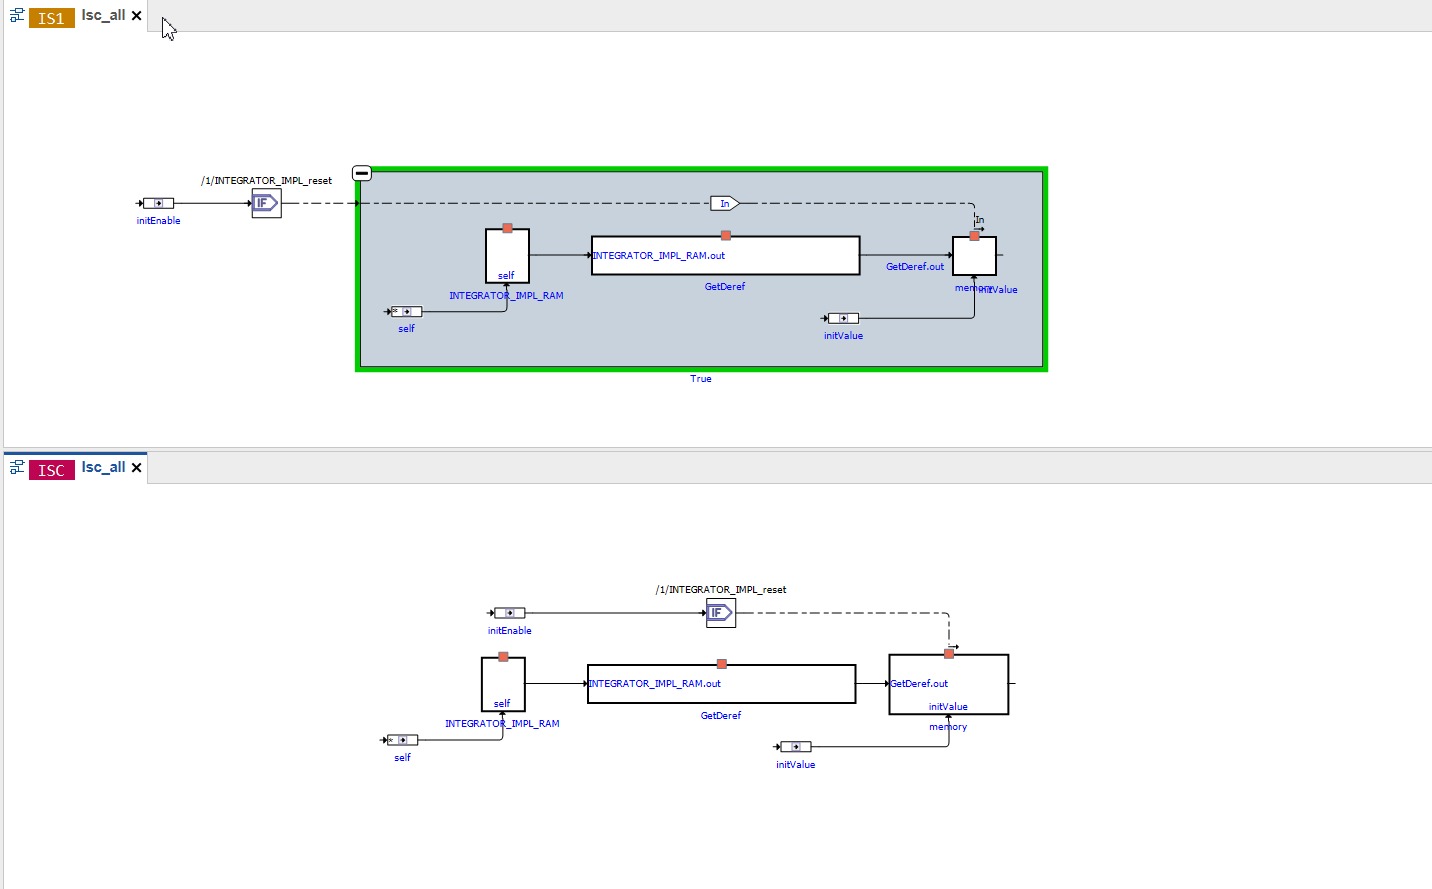
generateHierarchies
This configuration takes in a true/false to enable/disable artificial hierarchies in C-Code model. When enabled, artificial hierarchies are placed to logically group the elements. However, it could be disabled to have no hierarchies and view the model as it is in the original source code.
Default setting: generateHierarchies=true
Below, is an image depicting artificial hierarchies being created in the upper part. Here "True" which is expanded to show the contents, is an artificial hierarchy. The bottom part of the image shows C-code model with hierarchy generation being disabled, hence appears flat.
maxIterationForDataflowAnalysis
C-Code is converted to a data structure, which can be visualized as block diagram.
A part of the underlying algorithm is to calculate the connections between the blocks that represent the variables and operators of the C code functions. This is referred to as "Dataflow Analysis".
maxIterationForDataflowAnalysis is a configuration parameter to tweak the calculation of the connections through an iterative Dataflow Analysis.
-
A too high value can lead to high memory consumption and longer runtime than necessary in order to calculate all connections.
-
A too low value can result is unconnected blocks due to missing connections. The algorithm terminates before all connections have been calculated.
The value should be chosen such that it represents the minimal number of iterations even for the most complex C-code sources of a given ECU program.
Default setting: maxIterationForDataflowAnalysis=50000
A sample file is available in the examples sub folder of the EHB-CB installation directory. (..\examples\configuration\CCodeConfig.xml)
|
When maxIterationForDataflowAnalysis is exceeded, an "Error" will be logged in the log file. |
NOTICE
Incomplete, wrong or differing representation of model screenshots and interactive models from source data.
During the conversion of ASCET models, Simulink/Stateflow models or C-Code to interactive models and/or SVG graphics, the generated outputs may differ from the original model visualizations. As C-Code is written in textual form while interactive models are graphical diagrams, the semantic and interpretation can differ.
The following deviations between the model and the EHANDBOOK Container content may occur:
-
Missing or wrong graphics
-
Wrong targets on linked graphics
-
Wrong model links
-
Wrong model hierarchy links
-
-
For C-Code visualizations, different interpretations and semantics
Possible root causes of these deviations are:
-
Link specification in input text does not match to model hierachy path
-
Referenced model/source files are missing
-
Matlab connection for mask generation in Simulink was broken,
-
EHB-CB tool error due to internal error or unsupported source content
-
Technical limitations, especially for representing C-Code as graphical visualization
To identify deviations:
-
Check the entries in the log file of the generated EHANDBOOK Container for Warnings and Errors
-
Check the links between SVG graphics and interactive models in the EHANDBOOK Container
It is the responsibility of the creator of the EHANDBOOK Container to check the log files generated by EHANDBOOK Container-Build and to check the outputs for wrong model references and initiate the correction in the sources.
To ensure consistency and mitigate limitations:
-
Check the release notes and the known issues of EHANDBOOK Container-Build as well as EHANDBOOK-NAVIGATOR.
-
Compare the C-Code source code with the its graphical representation in EHANDBOOK-NAVIGATOR.
Support for Preprocessor Macros in C-Code
EHB supports preprocessor macros used in C-code. These macros can influence the model behavior and need to be handled properly for accurate representation in the EHANDBOOK.
The values for preprocessor directives can be provided in two ways:
-
Defined directly within the C-code (e.g., using #define statements).
-
Supplied through metadata (.mdx) file
This ensures that the preprocessing logic is correctly resolved during the container build process and reflected in the interactive model view.