How to Protect and Report on Containers
This page covers password protection, container encryption, and the HTML generation report.
Container Encryption
Encrypted containers can be generated by using the command parameter -epwd or -epwdf. The password can be passed either in the command line e.g. -epwd "qwertz" or within a password file e.g. -epwdf ./my_password_file.txt. If using a separate password file, the password must be surrounded with % characters e.g. %my_secret% as content of the password file. The password file is deleted after container encryption.
The password should satisfy the following credentials:
-
Password length: minimum 4; maximum 255 characters
-
Password characters: alphanumeric, special characters are allowed
-
Password pattern: No special pattern is required
The container gets the new file extension .ehbcrypt. It can be opened in the EHB-NAV in the same way. But after section of the container file, the user will be prompted for the correct password to be typed in.
HTML Container Report
The HTML Container Report provides a structured overview of issues encountered during container generation. It helps users quickly identify errors, warnings, broken images, and affected function components.
The HTML Container Report is generated by default during container generation. The report is created in the specified output directory.
Dashboard
The Dashboard provides a high-level overview of the container generation and its health status.
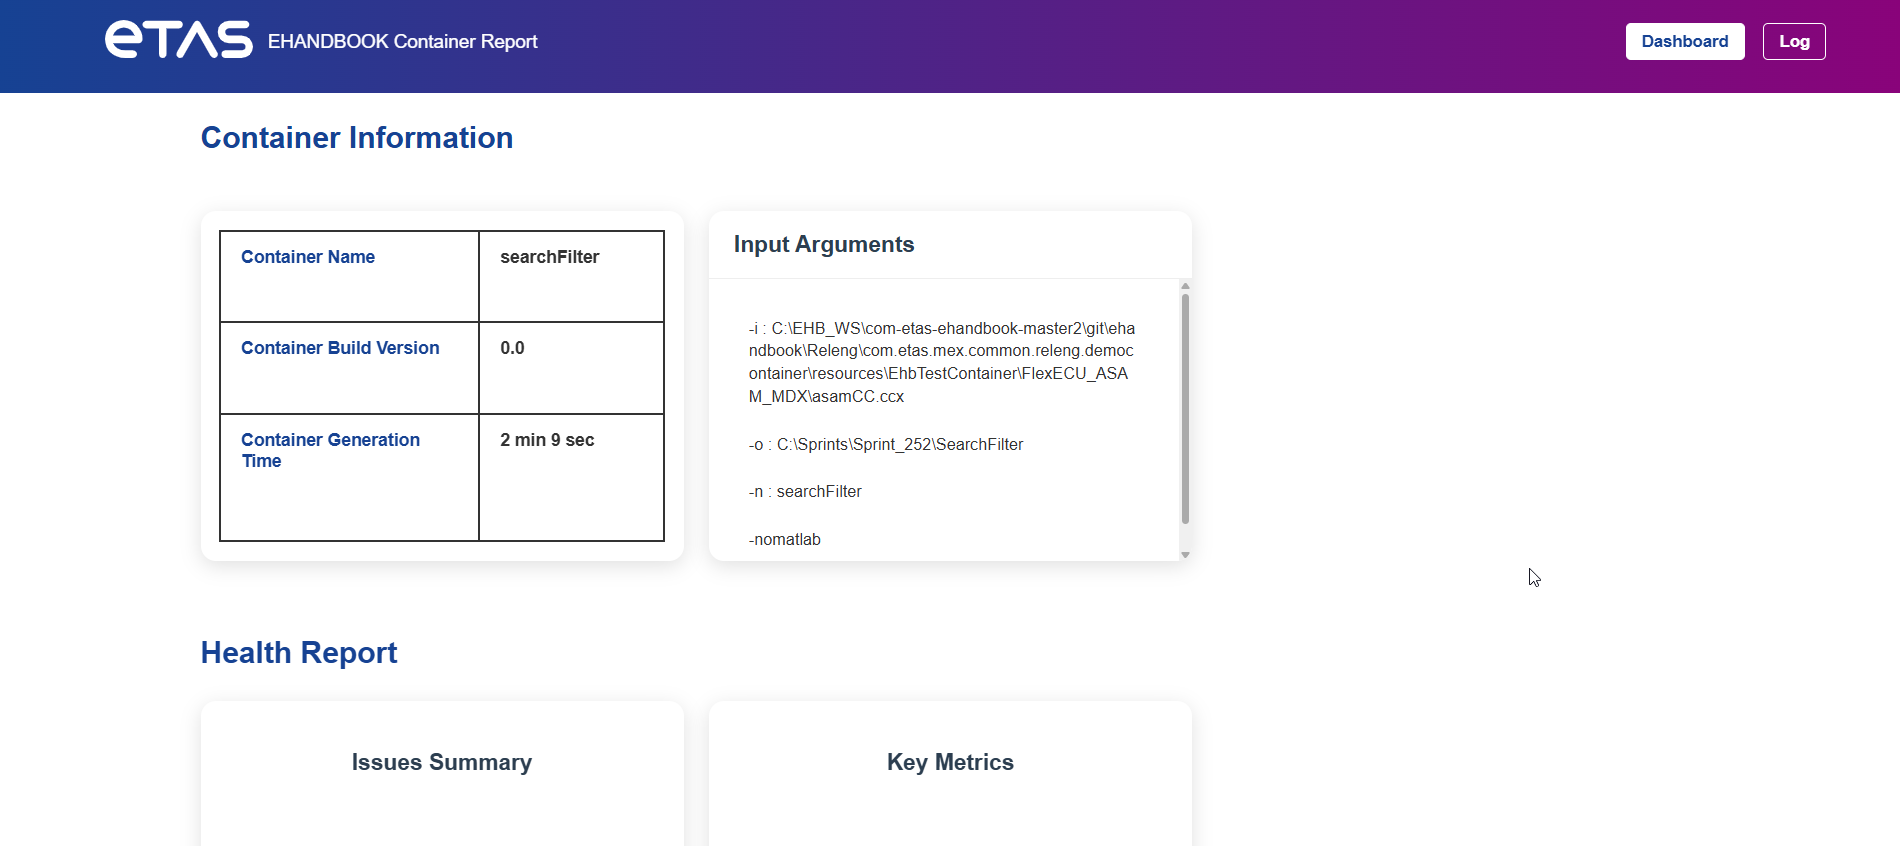
It contains the following sections:
Container Information
The Container Information section displays metadata about the generated container.
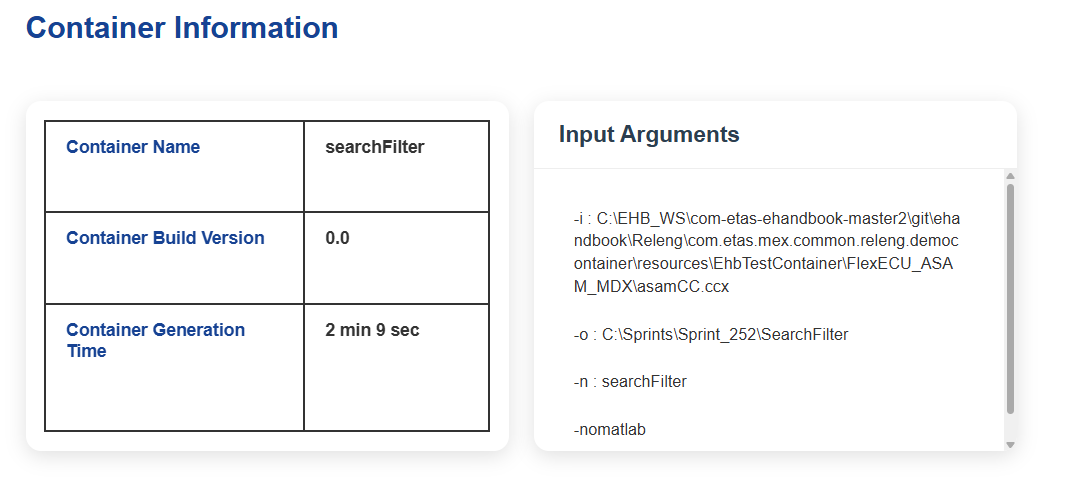
The following information is shown:
| Field | Description |
|---|---|
Container Name |
Name of the generated container. |
Container Build Version |
Version number of the generated container. |
Container Generation Time |
Total time required to generate the container. |
Input Arguments |
Command line parameters used during container generation. |
The Input Arguments section helps users to verify the exact configuration used during generation.
Example parameters include:
-
Input model path
-
Output directory
-
Container name
-
Additional arguments
Health Report
The Health Report summarizes the overall health of the generated container.
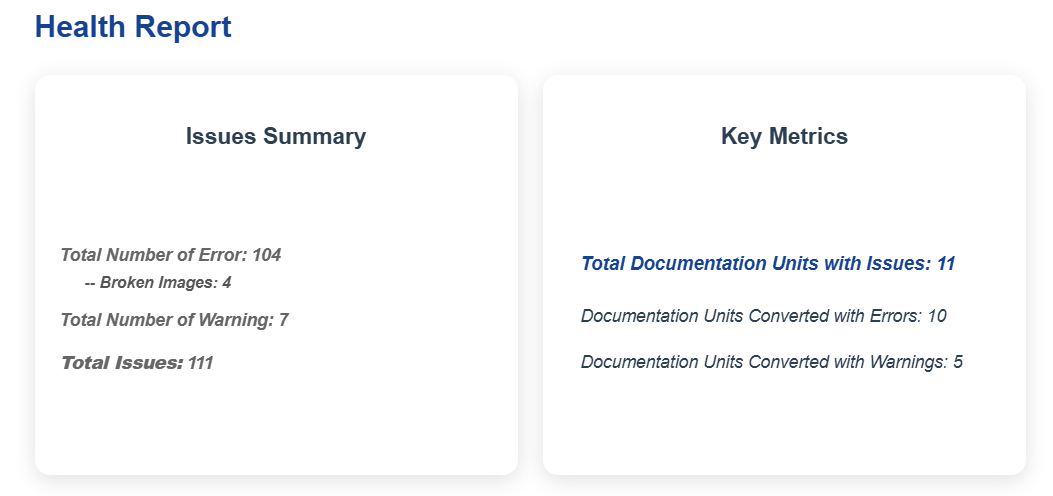
It contains two panels:
Issues Summary
The Issues Summary provides a quick overview of detected issues.
Example information displayed:
| Metric | Description |
|---|---|
Total Number of Errors |
Number of errors detected during container generation. |
Broken Images |
Images referenced in the model but not found during generation. |
Total Number of Warnings |
Warnings generated during container generation. |
Total Issues |
Total number of detected issues including errors and warnings. |
This section helps users quickly assess the severity of problems in the container.
| The metrics Total Number of Errors, Broken Images and Total Number of Warnings are interactive links. Selecting one of these metrics opens the Detailed Log View and automatically filters the log entries according to the selected issue type. |
Container Health Report
The Container Health Report provides an overview of the conversion quality of the generated container. It helps identify documentation units that were converted successfully and those that require attention due to warnings or errors.
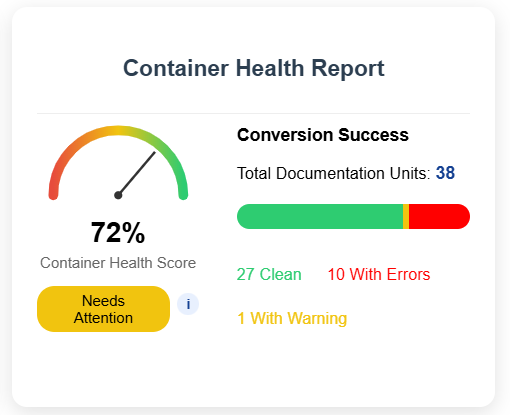
Health Score Calculation
The Container Health Score is calculated based on the number of documentation units, warnings, and errors generated during conversion.
Formula
The health score is computed using the following formula:
Score = Total Documentation Units
    	- (Documentation Units with Errors × 1.0)
    	- (Documentation Units with Warnings × 0.5)

Final Percentage = (Score / Total Documentation Units) × 100
Status Classification
Based on the calculated health score percentage, the container status is determined as follows:
| Health Score | Status |
|---|---|
>= 80% |
Healthy |
>= 60% and < 80% |
Needs Attention |
< 60% |
Critical |
Example
For the report shown above:
-
Total Documentation Units:
38 -
Documentation Units with Errors:
10 -
Documentation Units with Warnings:
1
Calculation:
Score = 38 - (10 × 1.0) - (1 × 0.5)
      = 27.5

Final Percentage = (27.5 / 38) × 100
                 = 72%
Since the final percentage is between 60% and 80%, the status is displayed as: Needs Attention
|
Click the information icon (i) in the Container Health Report to open a pop-up dialog that displays the detailed Health Score Calculation formula used to compute the container health percentage and status. |
Detailed Log View
The Detailed Log View provides a complete list of all log entries generated during container creation. It allows users to analyze errors, warnings, and other issues in detail.
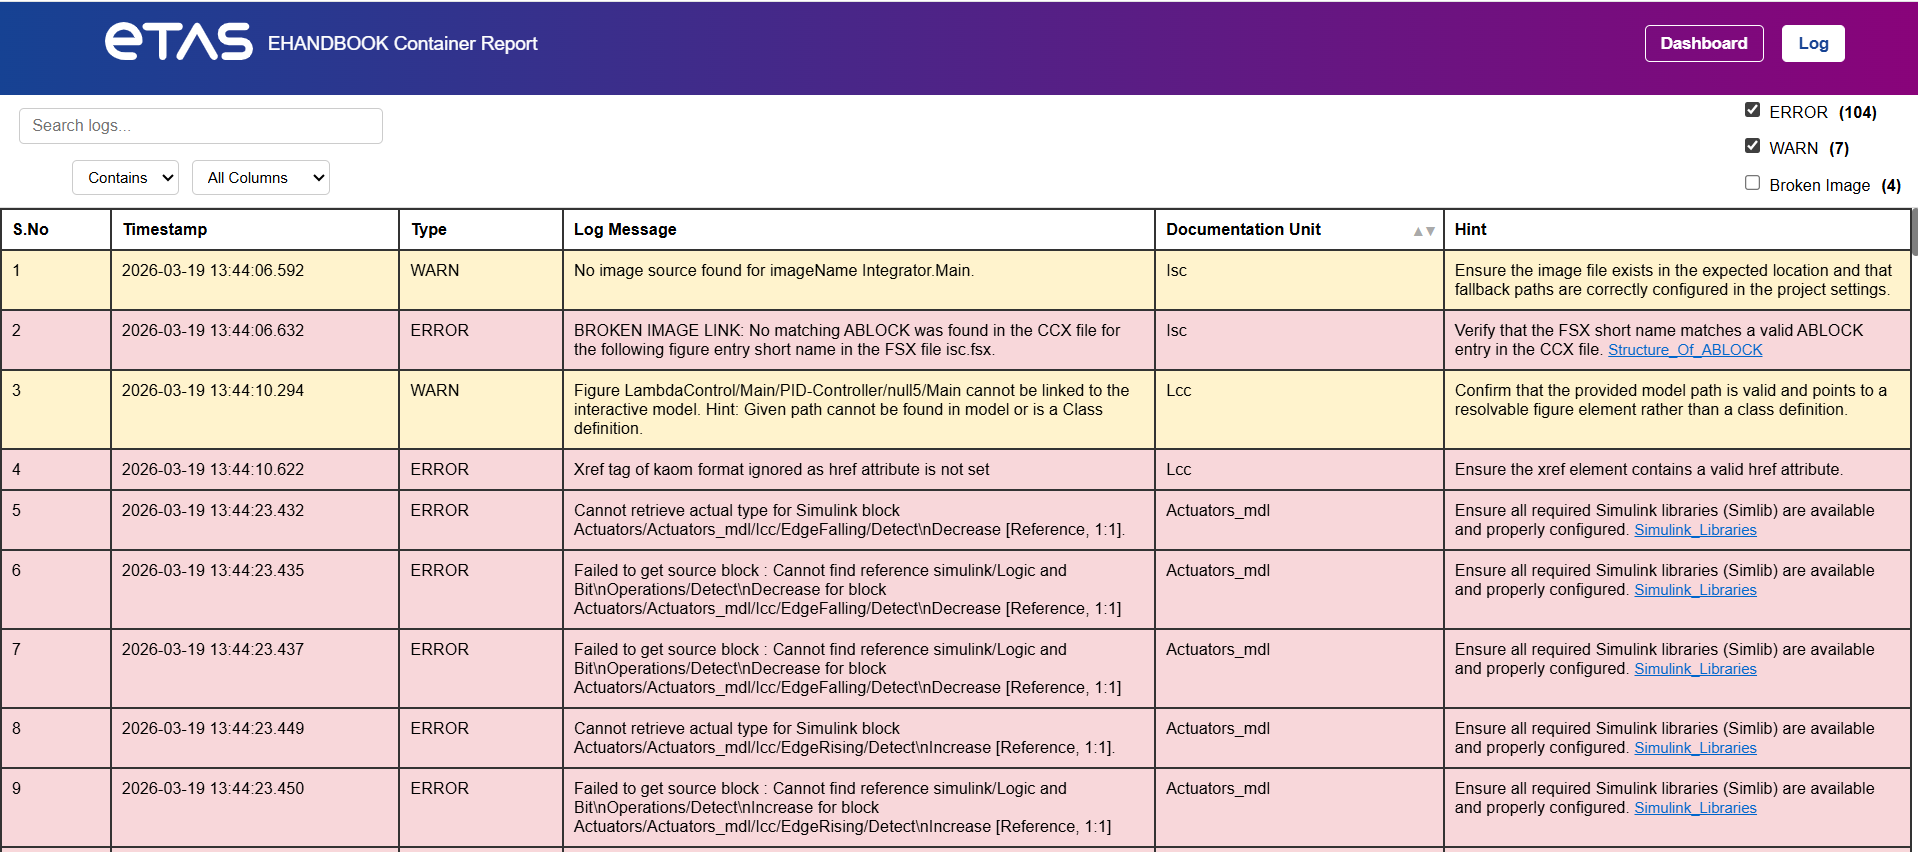
Each log entry contains the following fields:
| Column | Description |
|---|---|
S.No |
Sequential log entry number. |
Timestamp |
Time when the log entry was generated. |
Type |
Severity level of the log entry. Possible values include: * ERROR * WARN |
Log Message |
Detailed description of the issue. |
Documentation Units |
Name of the affected Documentation Units. |
Hint |
Guidance on how to resolve the issue. In some cases, the hint also contains hyperlinks to relevant EHANDBOOK documentation, enabling users to navigate directly to detailed explanations or recommended solutions. |
Severity Levels
The report categorizes log entries by severity.
| Severity | Description |
|---|---|
ERROR |
Indicates a critical issue that may affect container generation or functionality. |
WARN |
Indicates a potential problem that does not stop container generation but may affect quality. |
Search Functionality
The report provides a search feature that allows users to locate specific log entries.
Users can search by:
-
Log message
-
Documentation Units
-
Hint text
Search options include:
| Option | Description |
|---|---|
Contains |
Finds entries containing the specified text. |
Exactly |
Finds entries matching the exact search text. |
Users can also choose which column to search using the column selector.
Example:
-
Search within Log Message
-
Search within Hint
Log Filtering
Users can filter log entries by issue type.
Available filters include:
-
Errors
-
Warnings
-
Broken Images
Selecting a filter updates the table to display only the relevant log entries.
Example:
-
Show only ERROR logs
-
Show only WARN logs
-
Show only logs related to Broken Images
Typical Usage Workflow
A recommended workflow for analyzing the report:
-
Open the HTML Log Report.
-
Review the Health Report to understand the overall container status.
-
Check the Issues Summary to see the number of errors and warnings.
-
Review the Key Metrics to identify affected documentation units.
-
Navigate to the Detailed Log View.
-
Use Search or Filters to locate specific issues.
-
Follow the Hints or documentation links to resolve issues.
Benefits
The HTML Log Report provides several advantages:
-
Easy identification of container issues
-
Structured error analysis
-
Fast troubleshooting
-
Documentation Units - level issue tracking
-
Integrated documentation links
Recommended Browsers
The recommended browsers for opening the HTML Log Report are:
-
Google Chrome
-
Microsoft Edge
|
HTML Report Coverage for Different Container Generation Flows: The HTML report generated during container creation does not uniformly include logs from all flows.
As a result, in scenarios involving UGG (either standalone or as part of UGG + iCB), the HTML report does not represent the complete set of logs. Users must refer to the original UGG log files separately to access full information. |